How to Tell If a Medication Is Working (and What Else It's Doing)
8 min read · Updated 2026-07-18
Two questions come up with any new medication: is it working, and is it doing something it shouldn't? Both have the same answer, and it isn't how you feel today. Log a baseline before the first dose, mark the start date, then compare window averages once your body has settled in.
Some medications announce themselves in an hour. Plenty of others - many antidepressants, mood stabilizers, some blood pressure medications - take four to eight weeks to reach full effect. That gap creates a genuinely hard question: is this doing anything?
There's a second question running alongside it. Search whether any given medication causes weight gain and you'll get the same unsatisfying answer every time: sometimes, for some people, to some degree. That's not evasion, it's how the data works. A side effect listed at 8% incidence means most people never get it and a few get it strongly.
Both questions have the same shape. Neither one is about the population, and neither one can be answered from memory. Six weeks in, "how do you feel compared to before?" is really asking you to compare today against a memory filtered through everything that's happened since - a rough patch at work, better sleep, worse sleep, hope, doubt. People abandon medications that were quietly working and stick with ones that never did, based on a comparison nobody could make in their head.
The onset window changes what "before and after" means
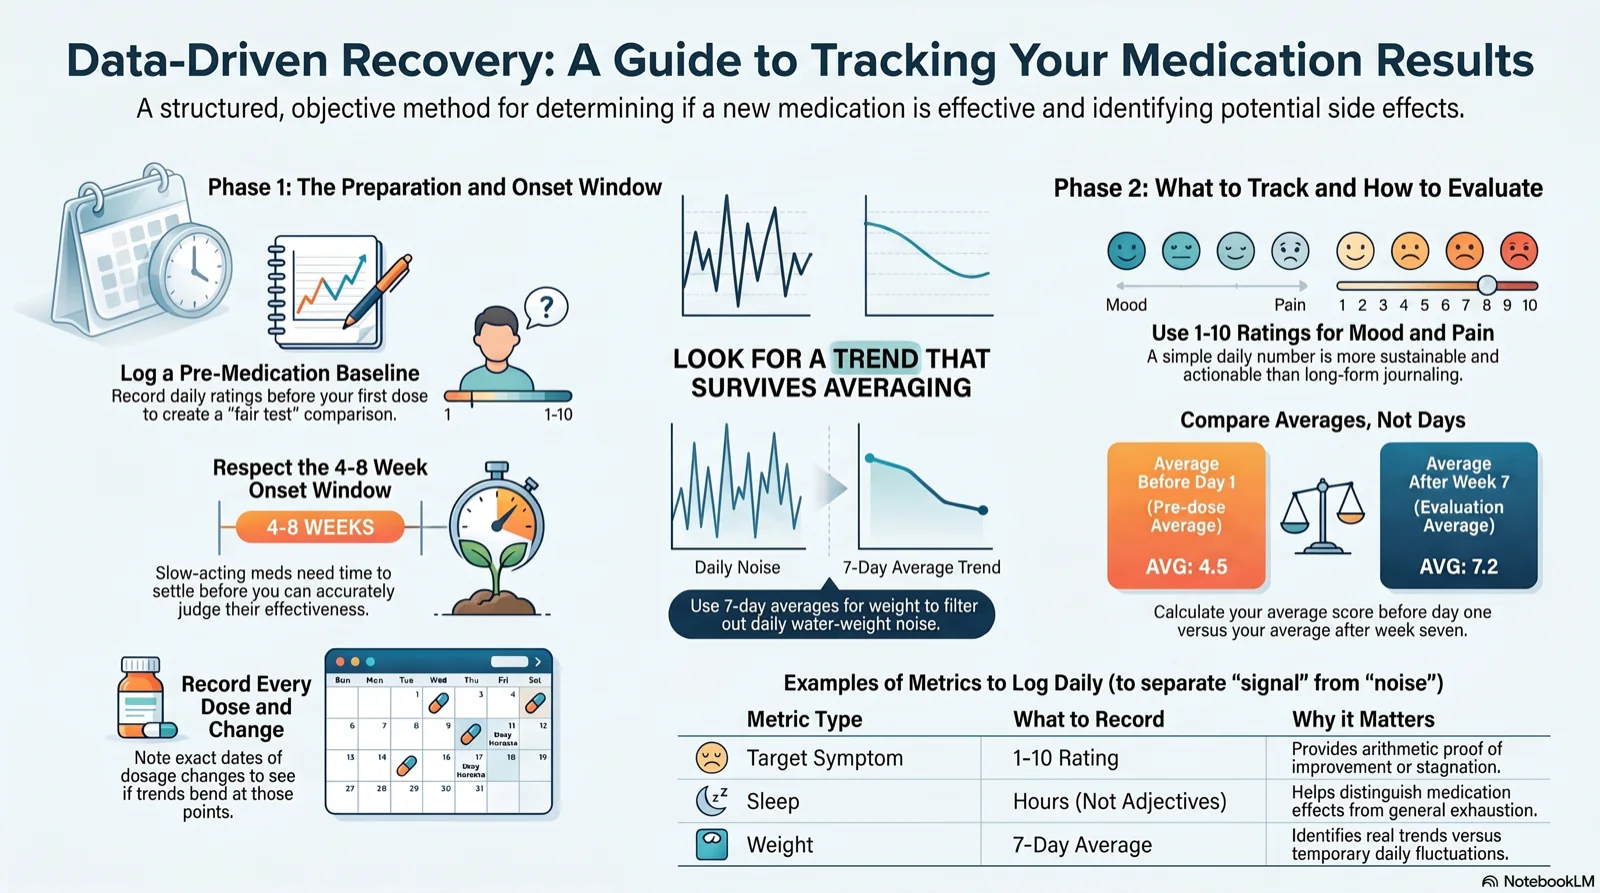
For a slow-onset medication, comparing week one against week two tells you almost nothing - you're comparing two points inside the ramp-up. The comparison that matters is everything before you started against everything after the expected onset window closed. If the ramp-up is expected to take six weeks, the fair test is your average from before day one versus your average from week seven onward.
That framing only works if you have numbers on both sides of the window. Which means the single most useful thing you can do starts before the first dose. The boring stretch you log before anything changes turns out to be the most valuable data you'll ever have, and it's the one people skip.
What to log
Two categories: the thing the medication is supposed to move, and the three numbers most likely to move when it isn't supposed to.
- A daily 1-10 rating of whatever the medication should help - mood, energy, pain, focus. One honest number a day beats a paragraph you'll stop writing by week two.
- Sleep duration. It is the most commonly disturbed and the easiest to log honestly - hours, not adjectives. A lot of off-target effects show up here first, and it helps separate "the medication helped" from "I finally slept."
- Weight, but as a 7-day average, never a single morning. Day-to-day weight swings a couple of pounds on water alone. A real medication effect is a trend that survives averaging, not a scary Tuesday.
- Every dose taken. Adherence is the first thing a doctor will ask about, and gaps explain a lot of "it stopped working."
- Any dosage change, on the day it happened.
Compare the averages, not the days
Once the window closes, the question becomes answerable with arithmetic: your average before starting versus your average since the window ended. "Mood averaged 5.3 before, 7.2 after" is a sentence a doctor can act on in a way that "I think maybe it's helping?" is not. Sample size matters too - a 1.9-point jump across nine days of data means more than the same jump across two.
Which features actually matter in a medication tracker comes down to this kind of thing. Dosage changes are part of the record. If your weight trend was flat for six weeks and bends in the week a dose doubled, that's a very different conversation than a drift that started before the prescription did. A date-stamped dosage change turns "I think it started around spring?" into a vertical line on a chart.
Signal versus noise
- A real effect persists across weeks of averages. Noise lives in single days.
- A real effect usually tracks the medication timeline - it starts after the start date, or it bends at a dosage change.
- Check the confound first. A weight change that lines up perfectly with a sleep change may be about the sleep. This is what correlation views across all your metrics are for.
- Absence of evidence counts. Three months of flat 7-day weight averages after starting is a genuinely reassuring answer to the question you were googling.
One important boundary
A log tells you what happened. It doesn't tell you what to do about it, and that includes a chart that scares you. Never start, stop, or change a dose on your own - bring the record to the person who prescribed it. Off-target effects are a trade-off conversation, and sometimes the answer is switching, sometimes it's dose timing, and sometimes it's that the thing you noticed is unrelated and here's why. All three go better with numbers.
HabitSync is built for this exact question. Log your doses and daily check-ins, tell it the expected onset window, and it plots your numbers from before you started against after the window closed. Weight is shown as a 7-day average with the daily noise de-emphasized, dosage changes appear as marked steps in your medication history, and your full record is preserved even if you stop taking something - ready for the next appointment.
Keep reading
- Why Your TDEE Calculator Number Is Wrong (and How to Fix It With Real Data) — TDEE calculators give you a population-average estimate. Here's how far off it can be, why it drifts as you diet, and how to replace it with your own data.
- Why Just Tracking a Habit Can Start Changing It — Noticing an automatic behavior is often what breaks its grip, before you try to change anything. Here's why logging a habit works even on days you don't act.
- Why Your Habit Tracker and Your Pill Organizer Should Be the Same App — Most people log habits in one app and medications in another. The interesting answers live between those two datasets - and splitting them hides them.
- Never Miss a Dose Without a Single Alarm: The Visibility Method — Reminder apps assume more alarms mean better adherence - until dismissing the alarm becomes the habit. Try routine anchors and visible dose counts instead.
- How Long It Takes to Form a Habit: 18 to 254 Days — The 21-day rule has no study behind it. The research people cite found habit formation took 18 to 254 days, averaging 66. Here's what moves you in that range.
- Does Habit Tracking Work? What the Evidence Says — In an NIH-funded trial of nearly 1,700 people, those keeping daily food records lost twice as much weight. What tracking does, and where it stops helping.
- Why Habits Carry You on Your Worst Days — When willpower runs out, people don't make worse choices - they make more automatic ones. Depletion raised habitual choices 28-32%, good habit or bad.
- Why Old Habits Come Back (and What to Do Instead) — Habits don't get erased. Extinction reversed the neural signature of a rat's habit, then it returned the instant retraining began. What that means for relapse.
- Why Sharing a Streak Isn't the Same as Sharing Progress — Most habit trackers with friends just mirror checkmarks. HabitSync Groups compare the real numbers behind them, and only what you choose to share.
- Why Rigid Habit Trackers Don't Survive Contact With an ADHD Brain — HabitSync wasn't built for ADHD, but flexible goal types, honest miss tracking, and a history that never resets fit where rigid trackers break down.
- How to Find Out What's Actually Affecting Your Sleep and Mood — How to tell a pattern from a coincidence in your own sleep and mood data, and why testing dozens of factors at once needs a correction most apps skip.
- Why the Scale Stopped Moving When Your Diet Didn't — A stall usually means your maintenance calories moved, not that you lost discipline. Here's how to measure where maintenance sits now from your own data.
- What Separates a Medication Tracker From a Reminder App — Most medication apps are reminder apps that log a checkmark. Here's what to look for if you want to answer whether a medication is actually working.
- Some Habits Don't Pay Off the Same Day — Compare today's habit against today's mood and anything with a lag looks useless. Why delayed effects are common, and how to test for them at several delays.
- Sharing Progress Without Sharing Your Weight — Accountability groups usually mean handing over private numbers. Here's a sharing model where every metric is off by default and weight can be percent change.
- What a Mood Tracker App Actually Records — A daily 1-10 rating plus an optional emotion from a 25-square grid. Here is what a mood tracker app records, and what it can tell you afterward.
- How an Accountability App Works Without a Leaderboard — Join with a code, pick what you share per metric, and compare derived progress lines. No leaderboard, and your raw daily logs never leave your account.
- Why Habits Built Around Your Character Strengths Actually Last — Using a signature strength in a new way for one week raised happiness for 6 months in a controlled study. Here's how to point a habit at one.
- One Missed Day Doesn't Erase a Streak. All-or-Nothing Thinking Says It Does. — Dieters who only believed they'd eaten a bigger slice went on to eat more, not less. The same distortion turns one missed habit day into a lost week.
- Why Naming the Urge to Skip a Habit Works Better Than Fighting It — Putting a feeling into words measurably calms the brain's threat response. Smokers who practiced it cut cigarette use 26% without the urge itself weakening.
- Which App Should You Use to Track 75 Hard, 75 Soft, or Exodus 90? — 75 Hard, 75 Soft, and Exodus 90 all come with an official app built for that one program. Here's when a flexible tracker fits better, and when it doesn't.
- Group Habit Challenges: Spiritual Fitness, Habit Stacking, and Mastermind Formats — Spiritual fitness challenges, habit stacking, trinity challenges, and masterminds share one mechanic: habits tracked together. Here's how to set one up.
- Can You Trust the 'Insights' Your Habit Tracker Shows You? — We ran our own correlation engine on pure random data and it found 24 fake patterns, some labeled 'strong.' Here's the statistics that get it to zero.
- Why Most Habit Stacking Apps Don't Actually Stack Anything — Most habit stacking apps just let you list habits. Real stacking chains a new one onto a routine you already run, then tracks the chain, not each habit alone.
- Does Alcohol Affect Sleep? What Two Reviews Found, and How to Check Your Own Nights — About two drinks is enough to delay and cut REM sleep, and falling asleep faster only showed up near five. What two reviews found, and how to check your nights.
If you want to see this in the app, here is how HabitSync tracks medications.